How to find out TOP talkers in your network
Sometimes it is very useful to find out current top talkers in your network, affecting your local interface. You can figure out what it’s going on and what IP can be possible source of congestion.
UNIX/LINUX procedure
Issue following command, by parameter -c you can configure amount of packets what will be captured, by parameter -i specify interface you want to sniff on:
sudo tcpdump -tnn -c 40 -i eth0 | awk -F "." '{print $1"."$2"."$3"."$4}' | sort | uniq -c | sort -nr | head

Output of analyzing 40 packets
WINDOWS procedure
In Windows OS we will use well-known application Wireshark. Normally a network interface will only “receive” packets directly addressed to the interface. Promiscuous mode allows the interface to receive all packets that it sees whether they are addressed to the interface or not. By enabling interface in promiscuous mode you can easily sniff traffic and based on further analyse you can figure out who is possible top-talker. It is very useful in case you are experiencing some kind of broadcast (multicast) storm and want to identify source of your congestion.

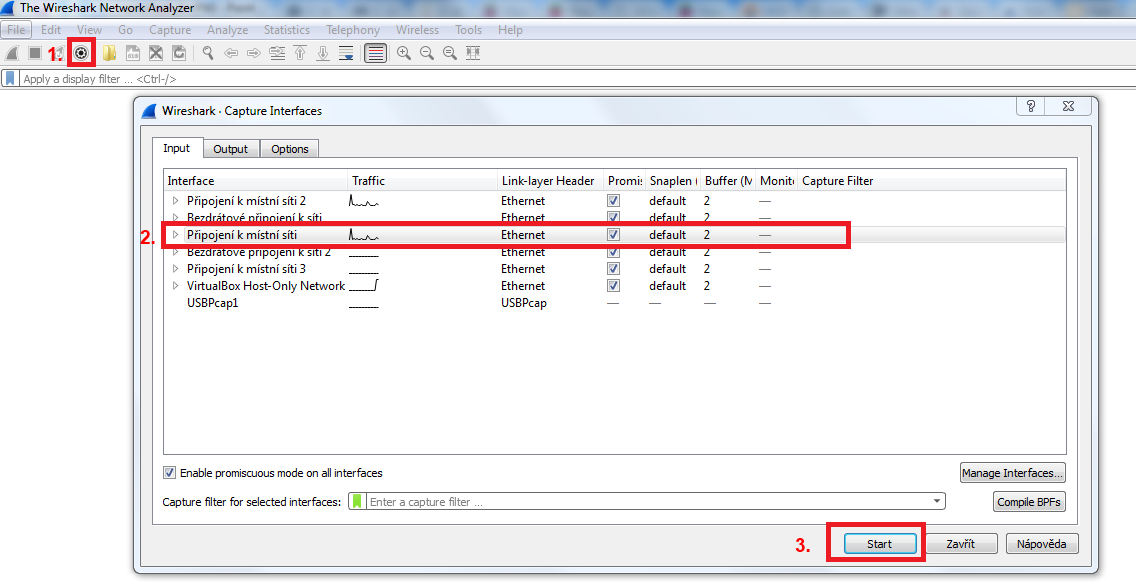
Selection of interface and starting packets capture
1. Click button to open capture interface settings
2. Select interface which you want to capture traffic on
3. Click “Start” button to start capturing

Stopping capture and selecting Conversations
4. After a few seconds you can “Stop” capturing of traffic
5. Select “Statistics”
6. Choose “Conversations”

Conversations dialog where you can filter and see full statistics of captured packets
Simply by selecting desired port, ordering based on “Bytes” you can see souce/destination IP which is originating the most packets. Do not forget that you will not be able to see all traffic in your network but you can capture traffic which does not have to be addressed directly to your interface but can influence also your network performance (e.g. broadcast storm …).

